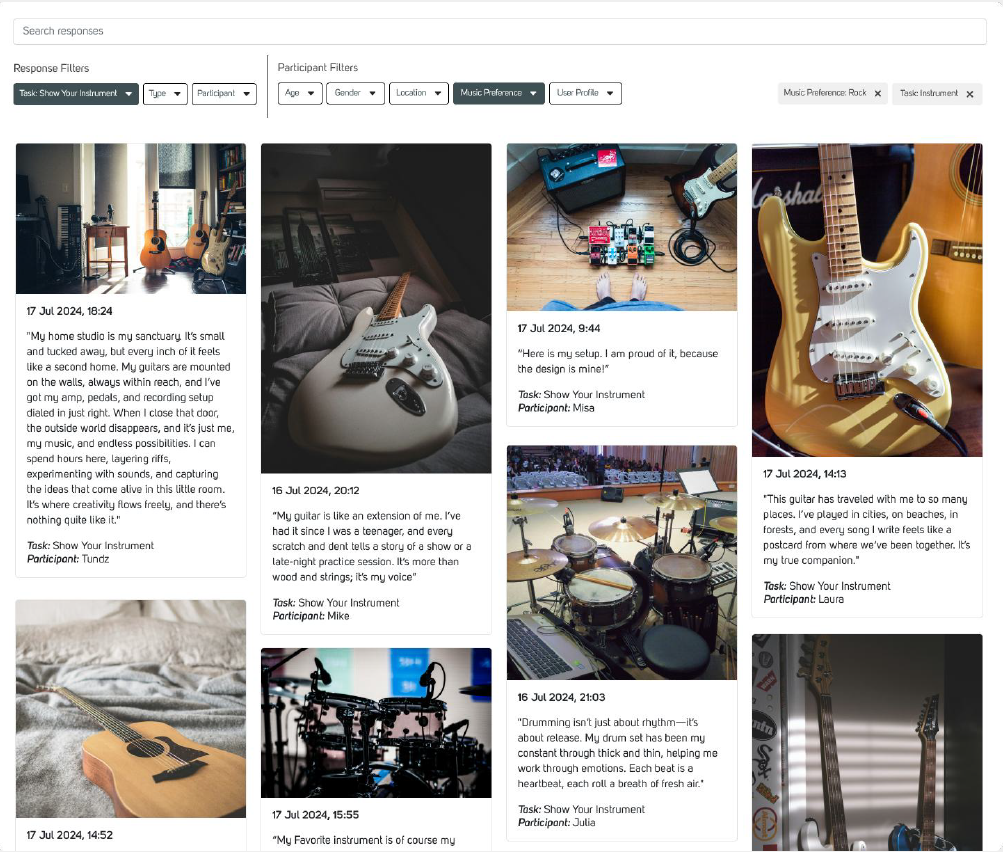
Interactive Dashboard:
All collected responses are displayed on a clean, visually intuitive dashboard, designed to feel familiar, like Pinterest.
This layout makes it easy to scan through participant input, spot emerging patterns, and identify key themes at a glance.
Dynamic Filters:
Brainstork automatically generates filters based on the demographic and custom data provided during participant import.
These filters are project-specific and give researchers the flexibility to segment responses with precision, making it simple to compare different participant groups or behaviours.
Flexible Data Segmentation:
Advanced filtering tools let you break down your data by task, response type, demographics, or any combination of criteria.
This allows for deeper, more focused analysis and helps generate actionable insights tailored to your target audience.